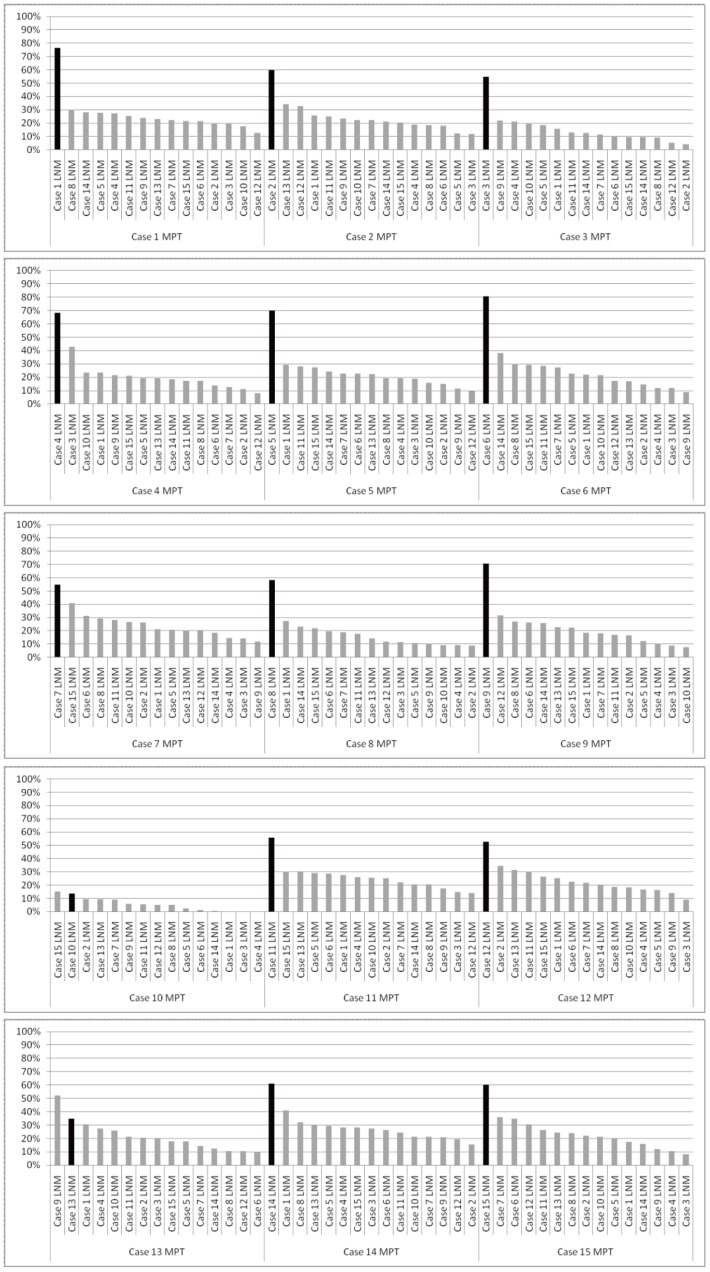
Figure 4. Concordance rates of genomic profiles between MPTs and LNMs.
Concordance rates of genomic profiles between MPTs and the paired LNMs (intra-case comparison), and MPTs and LNMs in the other 14 cases (inter-case comparison) were calculated as described in Materials and Methods. The concordance rates for intra-case and inter-case comparisons are shown by black- and gray-colored bars, respectively.

