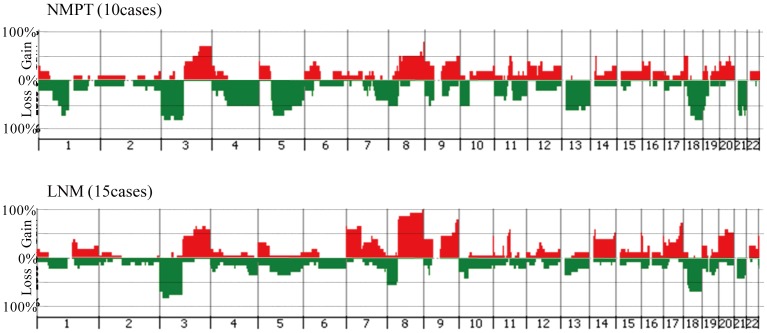
Figure 6. Genome-wide frequencies of CNAs in 10 NMPTs and 15 LNMs.
Horizontal lines: oligonucleotide probes are shown in order from chromosomes 1 to 22. Within each chromosome, clones are shown in order from the p telomere to the q telomere. Vertical lines: frequency (%) of gains (positive axis) and losses (negative axis) are shown for each probe.

