
Figure 5. The fraction of all transcripts receiving an annotation using transitive alignment, grouped by e-value threshold of the transcript's best SwissProt match.
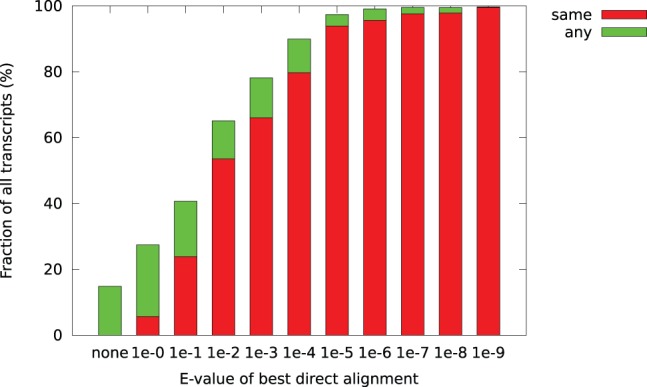
Red bars indicate that the gene symbol of the best SwissProt match is also among the transitive annotations (see also Fig. 6), green bars that only different proteins were matched.