
Figure 7. Alignments lengths resulting from transitive alignments divided by the corresponding score for the best direct alignment.
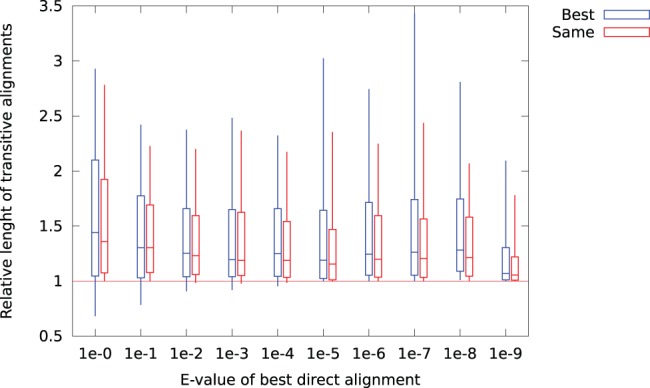
The plot shows median, quartiles, and 10- and 90-percentile length ratios, for the best transitive alignment (blue), and for the best transitive alignment with the same gene symbol as the best direct alignment (red).