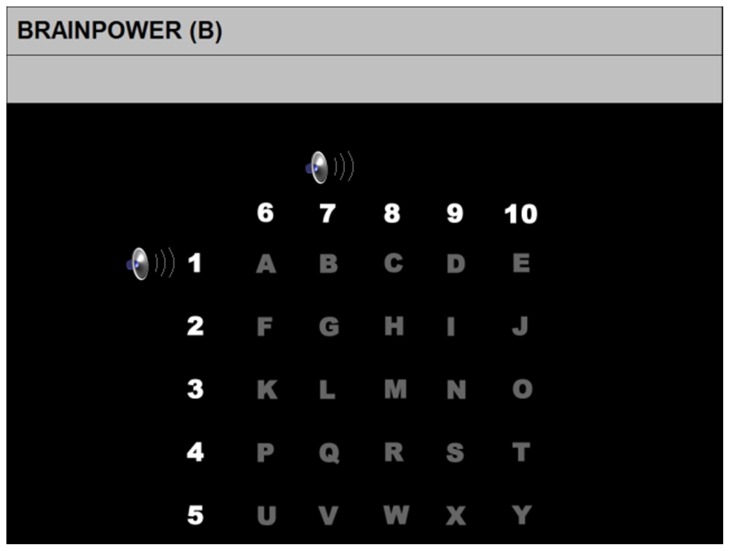
Figure 1. Visual support matrix displayed on a computer screen to the participant during the auditory P300-BCI experiment [22].
The matrix was identical to the visual P300 BCI matrix. The speakers displayed at the top left corner of the matrix indicate the auditory presentation of numbers and were not displayed during the actual experiment.

