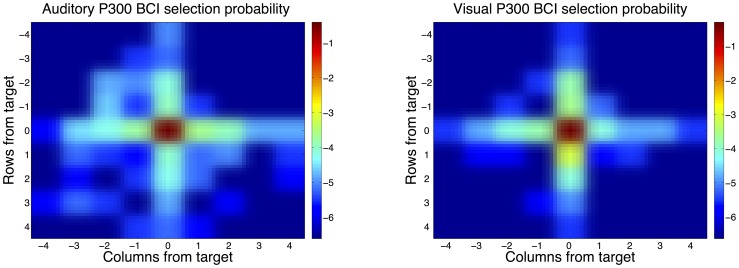
Figure 3. Probability of selecting the target matrix element (center) or a matrix element around the target is color coded on a logarithmic scale.
The x-axis shows how many columns to the left (negative) or to the right (positive) an error occurs. Correspondingly, the y-axis shows the probabilities for errors for rows above or below the target. Both in the visual P300 BCI (left) and the auditory P300 BCI (right) errors occur with a much higher probability on the same row or column as the target. This unequal distribution of the error probability was the motivation for applying mutual information to measure bitrate.

