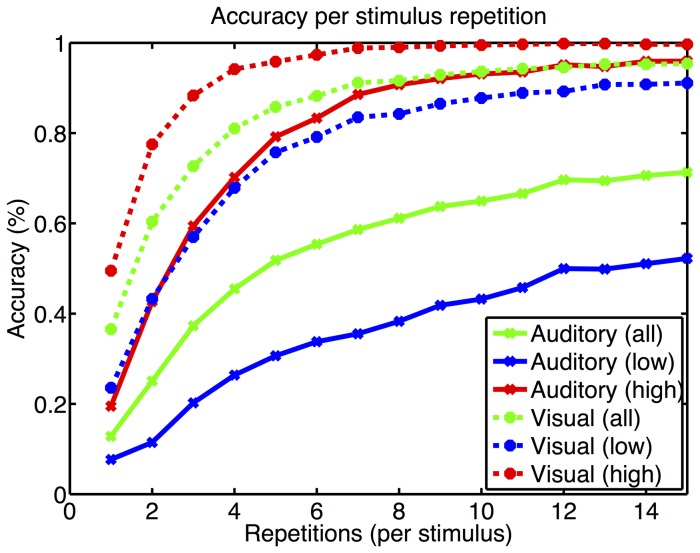
Figure 5. The letter selection accuracy is plotted as a function of the number of stimulus repetitions, i.e. flashes or spoken row/column numbers.
Data from all 63 EEG channels and a time window of 800 ms was available for the classifier. It can be seen that in the auditory modality only high aptitude users achieve an error rate below 20% comparable to the visual modality for all users. Dashed lines: visual P300 BCI; Continuous lines: auditory P300 BCI.

