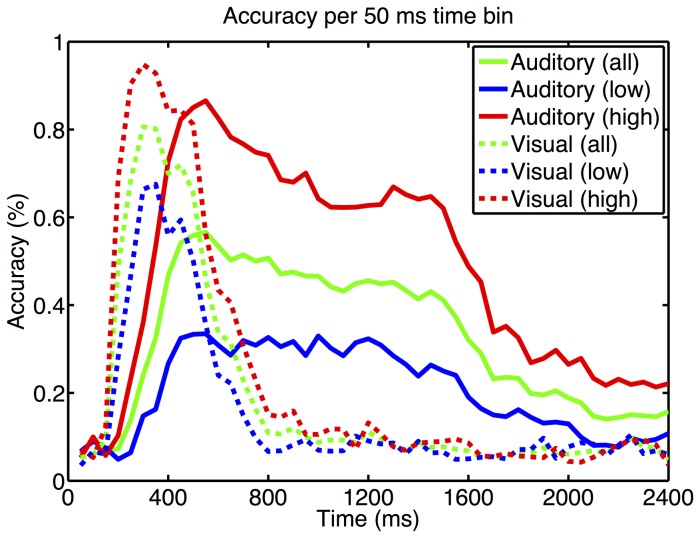
Figure 6. The letter selection accuracy is plotted as a function of time.
The data was split into non-overlapping 50 ms time bins that were used to train and test the classifier. Data from all 63 EEG channels was available for the classifier. For the visual P300 BCI the highest accuracy occurs in the expected P300 time window. In the auditory BCI neither the high nor the low aptitude users achieve an accuracy as high as in the visual P300 BCI. Dashed lines: visual P300 BCI; continuous lines: auditory P300 BCI.

