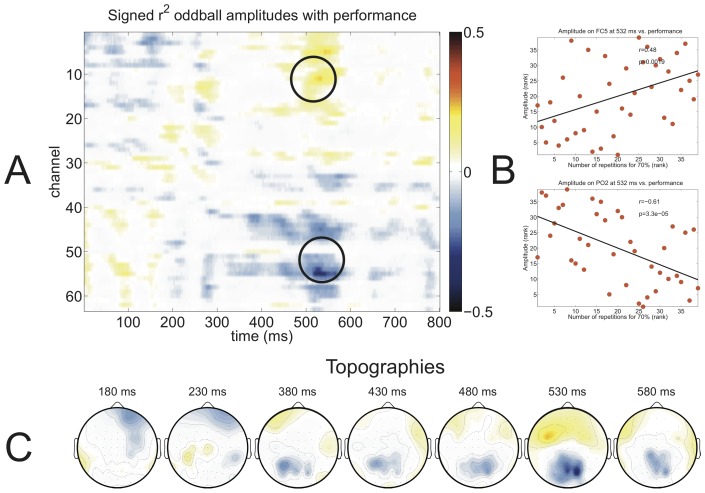
Figure 8. Signed  values between auditory oddball amplitudes of all time points and channels with auditory P300 BCI performance (defined as the number of sequences needed to reach 70% accuracy) are shown in red for positive correlations and in blue for negative correlations (A).
Two elements from the matrix were selected for visualization using scatter plots (B) showing a correlation of  on electrode FC5 and a correlation of
  on electrode PO2. Topographic distributions of the signed
  values are shown at the bottom (C). Note that due to the use of “number of sequences needed to reach 70% accuracy” as performance measure positive correlations indicate a decrease in performance with increasing amplitude, whereas negative correlations indicate an increase of performance with decreasing amplitude.

