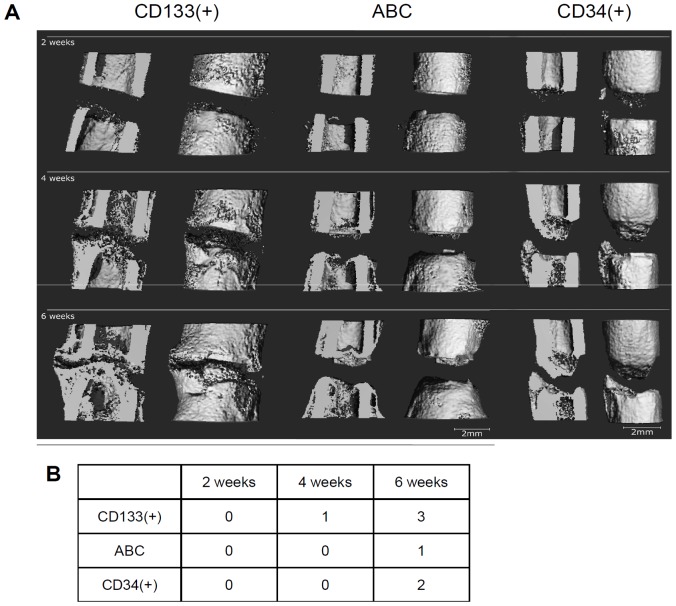
Figure 3. µCT analysis – 3D reconstructions of the bone healing progress.
(A) 3D reconstructions from µCT scans from one representative animal after 2, 4, and 6 weeks of the three groups are shown. In the CD133(+) group (left) mineralized tissue was formed at the endosteal as well as at the periosteal regions. After 42 days the gap had almost been bridged; a thin layer of radiolucent tissue still separated the bone ends. In the ABC group (middle) only very little callus formation was observed, appearing between the 28th and 42nd day after the osteotomy. No bridging but a cap-formation was observed, sealing the medullary canal. In the CD34(+) group (right) bone formation was further progressed than in the ABC group. After 6 weeks however, bridging did not occur and the medullary canal was closed at the proximal end. (Resolution 28 µm; scale: 2 mm). (B) Bridging score for the ABC group is lower compared with the bridging in the CD34(+) or CD133(+) group. The bridging score for the CD34(+) group showed better results than the ABC group but lesser results compared with the CD133(+). 5 areas in the osteotomy gap were investigated, 12, 3, 6, and 9 o'clock position and the centre region. The sum of bridged areas for the healing course is indicated in the table.

