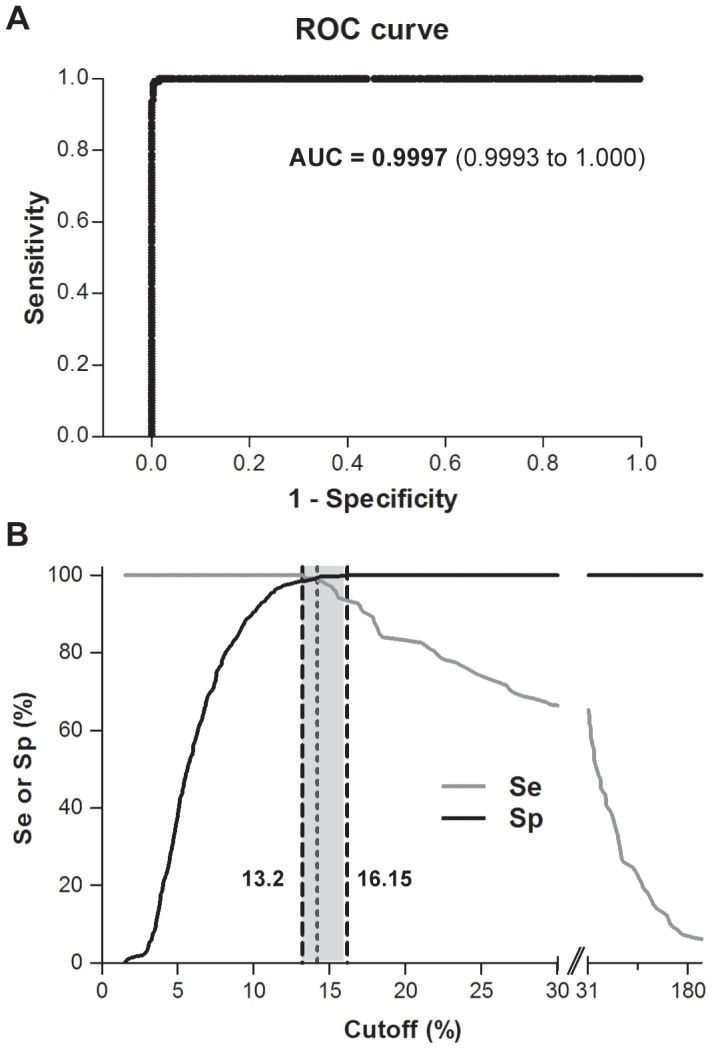
Figure 3. Receiver-operating characteristic (ROC) analysis of glycoconjugate-magnetic beads assay results.

A) ROC plot. The analysis was carried out considering as positive controls sera of patients with culture-confirmed brucellosis and culture-negative/serologically-positive patients with clinical diagnosis of brucellosis (138 sera), and as negative controls serum samples from blood-donors, healthy individuals occupational-exposed to the pathogen, patients with febrile syndrome and patients with other diseases (350 sera). AUC, area under the ROC curve. Values in parentheses indicate the 95% confidence interval. B) Plot of the diagnostic sensitivity (Se) and specificity (Sp) of the assay as a function of the cutoff value. The dot vertical line indicates the cutoff value that concurrently optimizes Se and Sp (cutoff = 14.18%, Se = 99.28% and Sp = 99.43%). The dash vertical lines indicate the cutoff values for which maximal Se or Sp is achieved (cutoff = 13.20%, Se = 100% and Sp = 98.57%; cutoff = 16.15%, Se = 93.48% and Sp = 100%).
