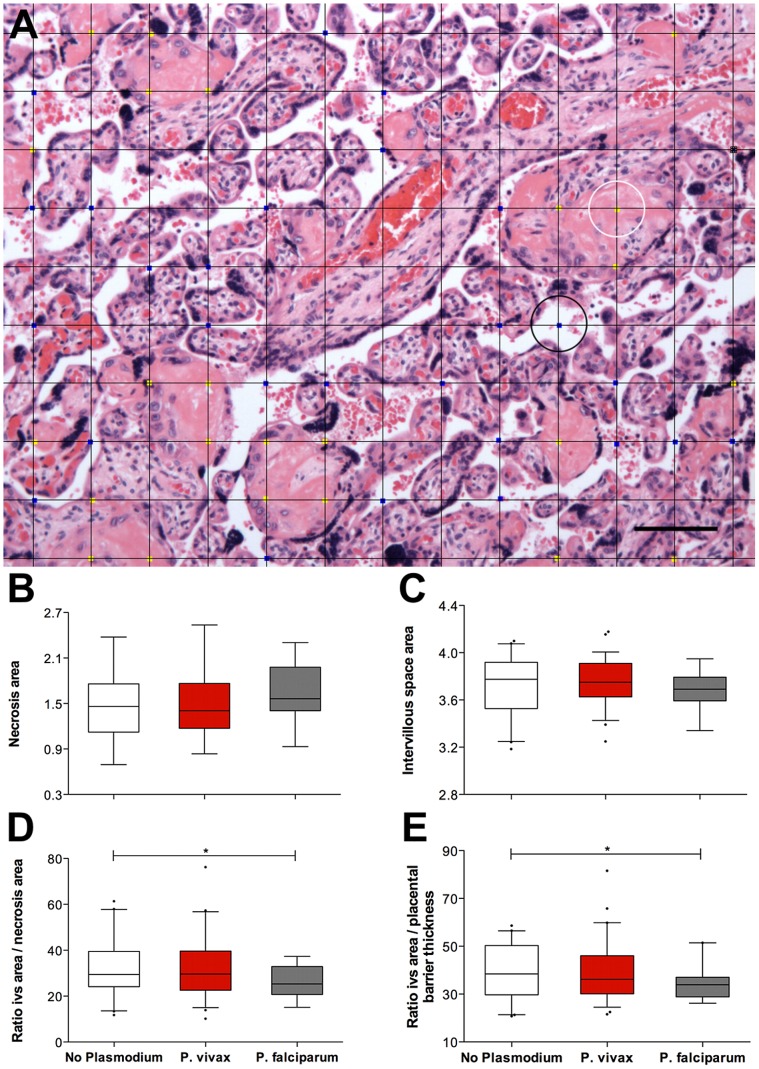
Figure 2. The placental parameters evaluated by Plasmodium species during infection.
For all placentas, areas of necrosis (B) and intervillous space (C) were measured by overlaying a square grid (A) and counting the number of intersecting points that touched necrotic areas (yellow dots; the white circle indicates an example) or intervillous space areas (blue dots; the black circle indicates an example). The ratios of intervillous space area per necrosis (D) and intervillous space area per placental barrier thickness (E) were calculated. The placentas in the “no plasmodium” group (n = 41; white boxes) appear to have similar necrotic areas and more intervillous space than the placentas in the “P. vivax” group (n = 59; red boxes). The placentas in the “P. falciparum” group (n = 19; grey boxes) exhibited more necrotic areas and less intervillous space. Graphs (B, C, D and E) represent the transformed data. The boxes represent the mean and standard deviation values. The whiskers represent the 5th and 95th percentiles. The photograph was taken using a Zeiss Axio Imager M2 light microscope equipped with a Zeiss Axio Cam HRc. Grid overlays and counts were performed using Image J.

