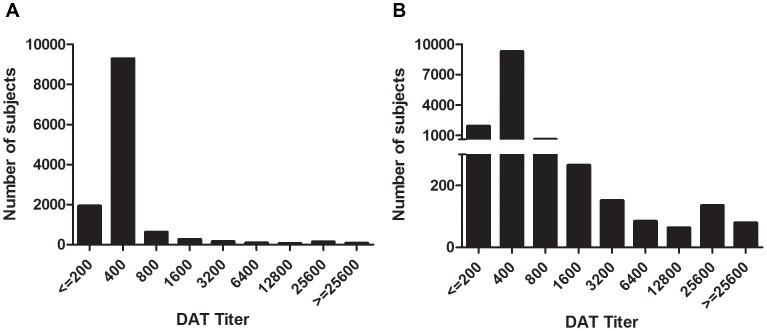
Figure 1. DAT titers at baseline.
Serologic titers are graphed for the 12,634 subjects without prior or current VL, measured by the DAT test. Numbers of subjects with positive DAT tests at the indicated dilution are shown. The two graphs show the same data on different scales, so that both large and small titer peaks can be appreciated.

