
Figure 5. Probability of VL, sero conversion, and sero-prevalence by age group.
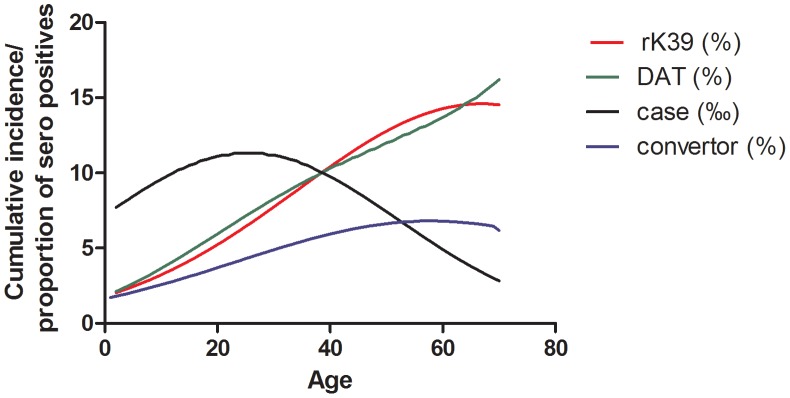
Cumulative VL incidence over the 2½ year period preceding the first round sero-survey, probability of DAT and rK39 positivity during the first round sero-survey, and probability of sero-conversion on either DAT or rK39 during the 12-months interval between the first and second round survey have been plotted by age.