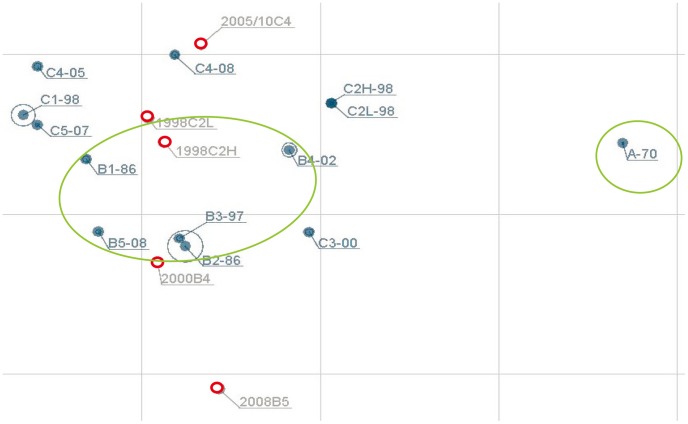
Figure 3. Antigenic map generated using serum cross-reactive EV71 neutralizing antibody titers presented in Figure 1.
The relative positions of strains (black) and antisera (red) were adjusted such that the distances between strains and antisera in the map represent the corresponding ratios between homologous and heterologous neutralizing antibody titers. The spacing between grid lines is 1 unit of antigenic distance, corresponding to a 2-fold dilution of antiserum in the neutralization assay.

