
Figure 1.
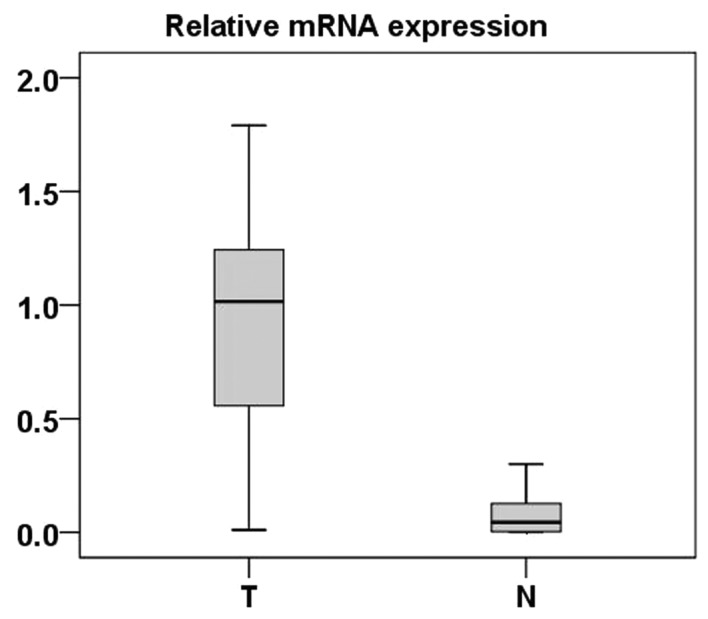
Real-time quantitative RT-PCR analysis of FER expression. The relative expression of FER mRNA in RCC tumor (T) tissue samples was higher than that in the paired ADTs (N) (n=48; P<0.001). The bottom and the top of the box represent the 25th and the 75th percentile, respectively, and the band near the middle of the box is the 50th percentile (the median). The ends of the whiskers represent the 2.5th percentile and the 97.5th percentile.