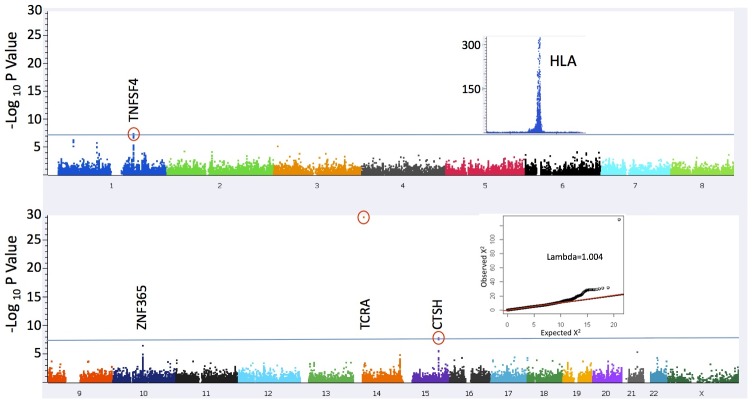
Figure 1. Manhattan Plot of association statistics.
The significance threshold used (blue line) was P = 5×10⁻⁸; The insets depict plots of 1) association results in a broad region encompassing the HLA locus (chr 6:24,067–35,474 kb) that were excluded from the present analysis (see Methods) and 2) QQ plot of results for 109,777 markers after excluding a 1 Mb window surrounding the associated loci (λ = 1.004). The inflation statistic for all 111,240 tested markers is 1.04.

