
Figure 6. Percentages of haplotypes from aUzPo and aBOO matched in selected ancient Eurasian populations.
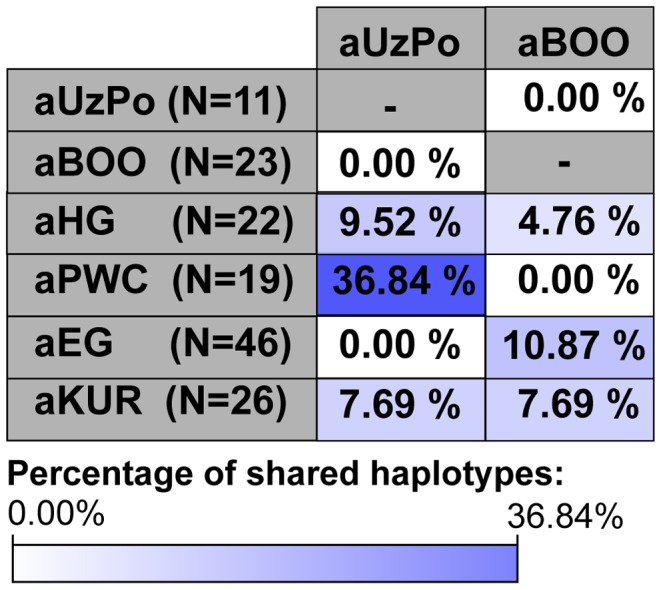
The cells were colored according to the gradient of percentages of shared haplotypes represented below the figure: from white for the lowest value of percentages of shared haplotypes (0.00%) to dark blue for the highest value of percentages of shared haplotypes (36.84% between aUzPo and aPWC).