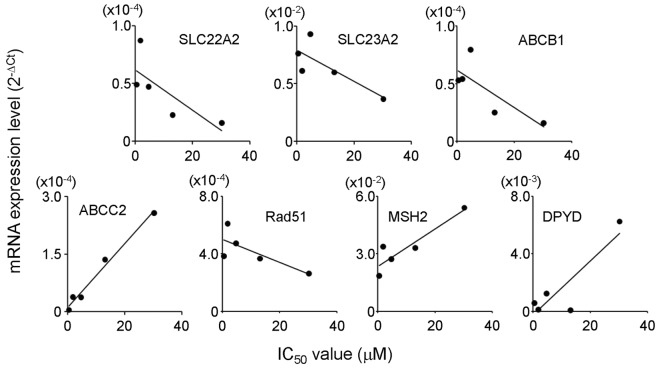
Figure 1.
Correlation between IC50 values for 5-FU and mRNA expression levels in the esophageal carcinoma cell lines. The IC50 values for 5-FU were obtained from growth inhibition studies (Table III). The mRNA expression levels (2−ΔCt) in the cells were evaluated by real-time RT-PCR assay using SYBR®-Green. The threshold cycle (Ct) values were used to quantify the PCR product, and the relative expression level of the target gene was expressed as 2−ΔCt. The ΔCt was calculated by subtracting Ct (β-actin; as an internal standard) from Ct (target gene). 5-FU, 5-fluorouracil; RT, reverse transcription.

