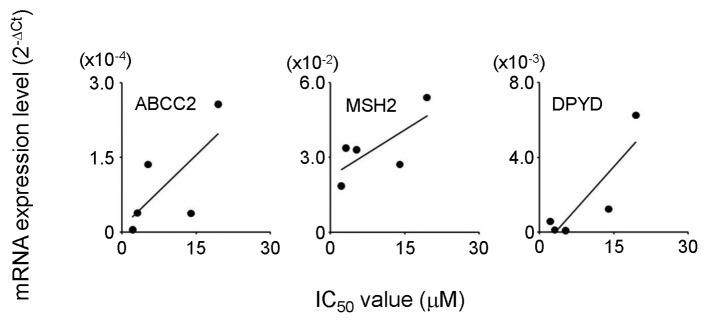
Figure 2.

Correlation between the IC50 values for CDDP and mRNA expression levels in the esophageal carcinoma cell lines. The IC50 values for CDDP were obtained from growth inhibition studies (Table III). The mRNA expression levels (2−ΔCt) in the cells were evaluated by real-time RT-PCR assay using SYBR®-Green. The threshold cycle (Ct) values were used to quantify the PCR product, and the relative expression level of the target gene was expressed as 2−ΔCt. ΔCt was calculated by subtracting Ct (β-actin; as an internal standard) from Ct (target gene). CDDP, cisplatin; RT, reverse transcription.
