Figure 1.

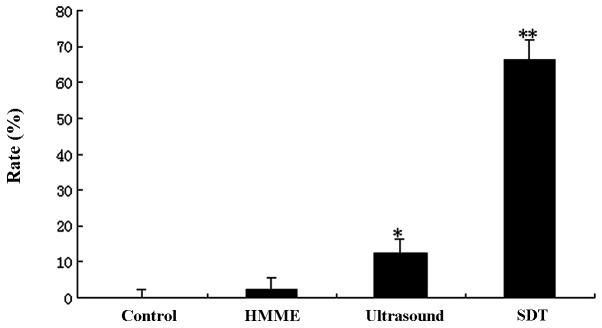
Growth inhibition rate of rat C6 glioma cells measured by MTT assay following sonodynamic therapy (SDT) treatment. Data represent mean ± SE (n=6). **P<0.01 vs. control, *P<0.05 vs. control. HMME, hematoporphyrin monomethyl ether.

Growth inhibition rate of rat C6 glioma cells measured by MTT assay following sonodynamic therapy (SDT) treatment. Data represent mean ± SE (n=6). **P<0.01 vs. control, *P<0.05 vs. control. HMME, hematoporphyrin monomethyl ether.