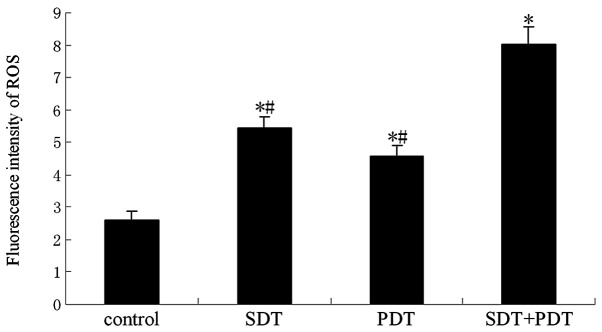
Figure 6.

Reactive oxygen species (ROS) production as indicated by DCFH fluorescence in different groups. Data are mean ± SE (n=6). *P<0.05 vs. control; #P<0.05 vs. SPDT. SDT, sonodynamic therapy; PDT, photodynamic therapy; SPDT, sonodynamic therapy combined with photodynamic therapy.
