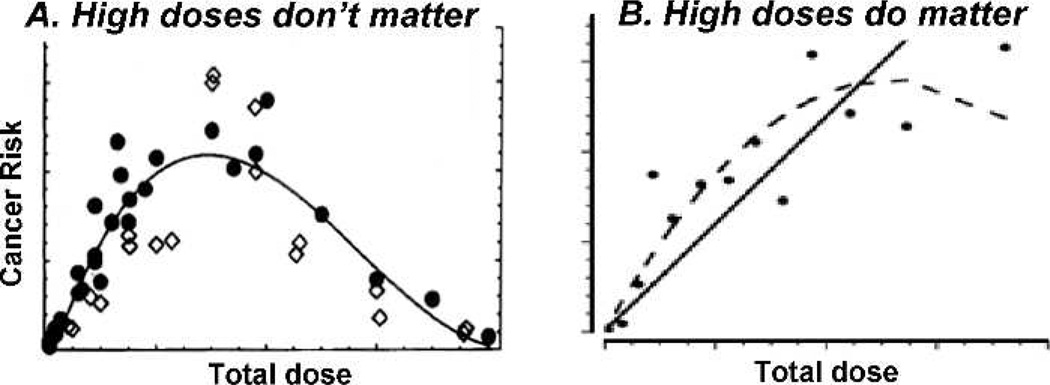
FIG. 2.
The significance of the shape of the dose-response curve for radiation-induced cancer at high doses. Panel A: Cancer risks decrease at high doses, due to cell killing – the Gray model: In this scenario high normal tissue doses will not contribute significantly to secondary cancer risks. Panel B: Cancer risks do not decrease sharply at high doses: In this scenario high normal-tissue doses may dominate secondary cancer risks.

