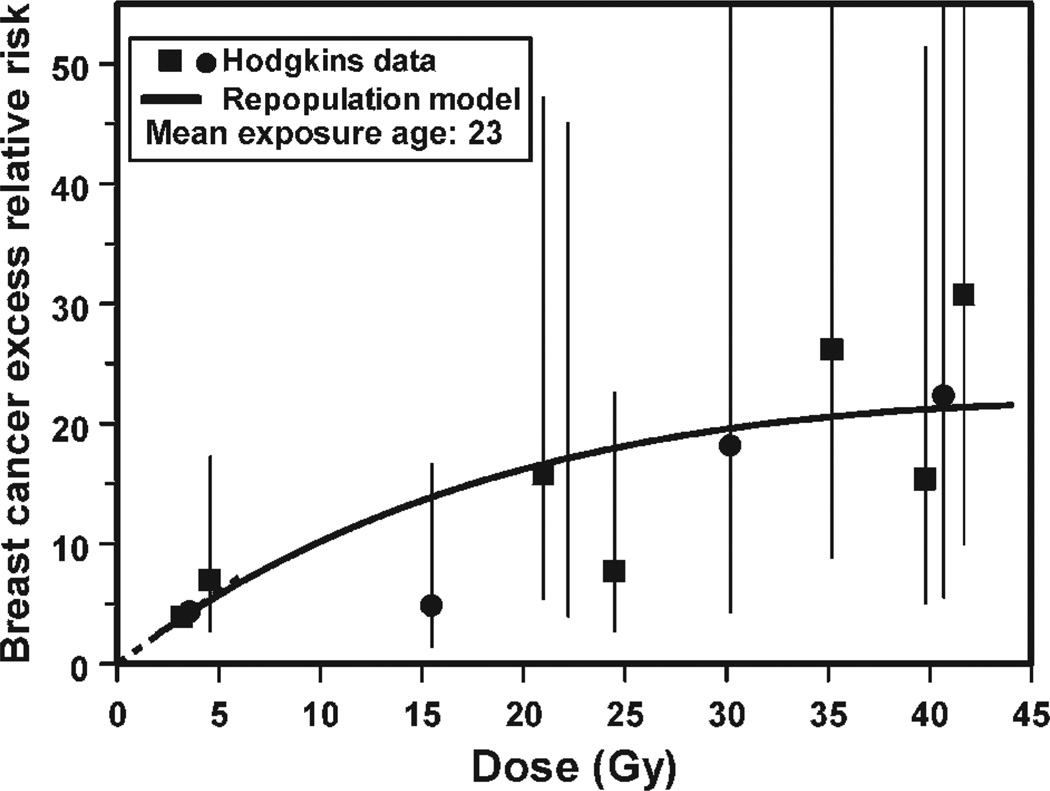
FIG. 3.
The data points show breast secondary cancer risks as a function of radiation dose at the location of the cancer, for Hodgkin’s lymphoma patients who underwent radiotherapy. Note the significance risks at very high doses where the standard Gray model (see Fig. 2A) would predict very small cancer risks, because of cell killing. The curve represents the prediction (26) of a model, which includes radiation-induced induction of pre-malignant cells and cell killing, and also accelerated proliferation of pre-malignant cells (see Fig. 4.) Figure redrawn from ref. (26).

