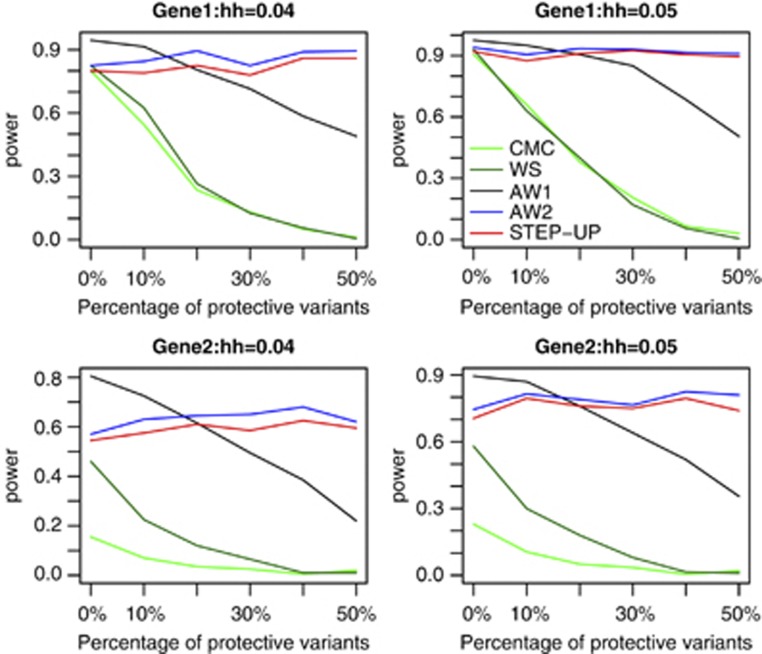
Figure 2.
The power comparisons of the five tests based on disease model 1. hh represents the total heritability of the 10 causal variants. Since there are 10 causal variants in total, 0, 10, 20, 30, 40, and 50% protective variants represent 0, 1, 2, 3, 4, and 5 protective variants. Sample size is 1000. P-values are estimated using 10 000 permutations and power is evaluated at a significance level of 0.001 using 200 replicates for each scenario. This simulation mimics regional association studies.

