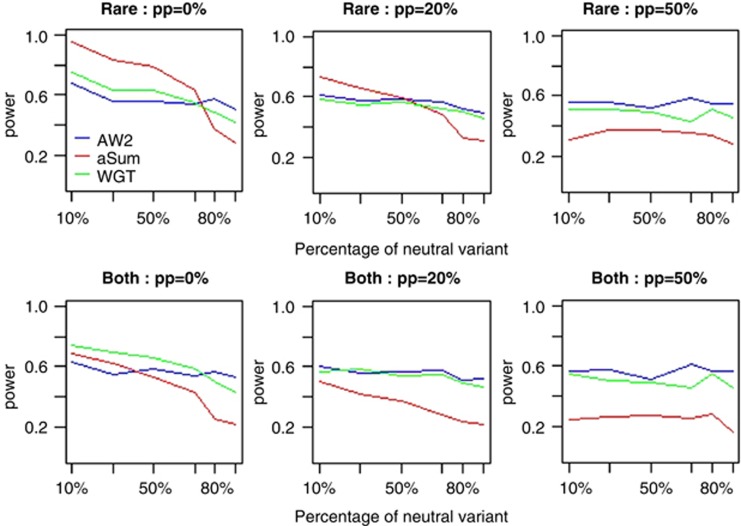
Figure 3.
The power comparisons of the three tests based on disease model 1 and using the haplotype structure of the Sgene. The total heritability of the all causal variants is 0.03. Sample size is 1000. P-values are estimated using 1000 permutations and power is evaluated at a significance level of 0.05 using 200 replicates for each scenario. pp represents for the percentage of protective variants. ‘Rare' means that only rare variants (MAF<0.01) are considered. ‘Both' means that both rare and common variants are considered. This simulation mimics candidate gene association studies.

