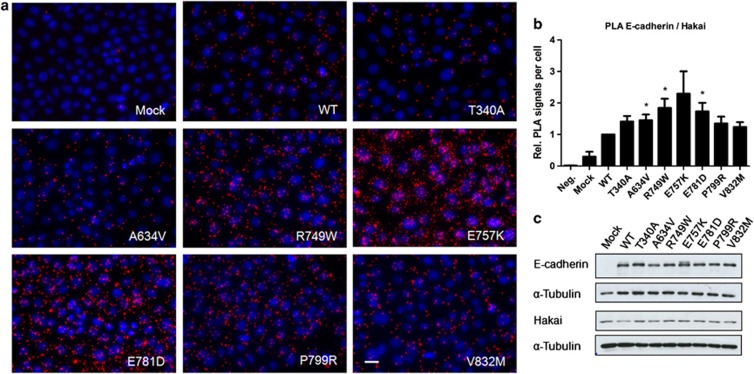
Figure 3.
E-cadherin deprived of p120-catenin is more susceptible to Hakai association. (a) The interplay of WT and mutant E-cadherin with Hakai was assessed by in situ PLA. Close proximity of these two proteins gives rise to PLA signals (red dots). Nuclei were counterstained with DAPI (blue). Scale bar represents 20 μm. (b) The graph shows the average of the relative number of PLA signals per cell±SE, n=4 (*P≤0.05). (c) Western blot was used to assess E-cadherin, Hakai and α-Tubulin expression levels.

