Figure 5.
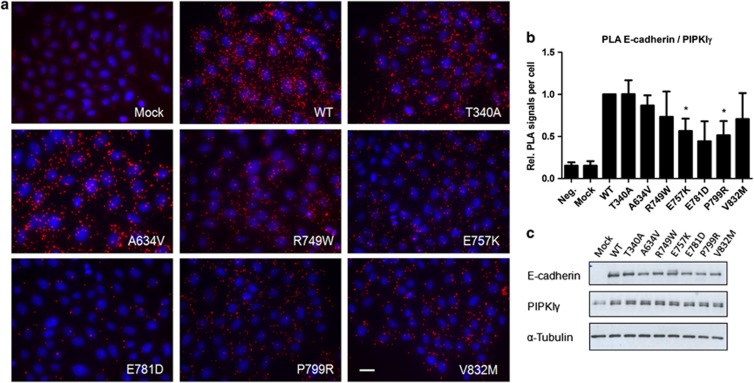
E-cadherin mutants have a decreased E-cadherin/PIPKIγ interplay. (a) Association of WT or mutant E-cadherin with PIPKIγ (red dots). Nuclei were counterstained with DAPI (blue). Scale bar represents 20 μm. (b) The number of PLA signals per cell was quantified in each condition (*P≤0.05). (c) Protein expression levels of E-cadherin, PIPKIγ and α-Tubulin were analyzed by western blot.

