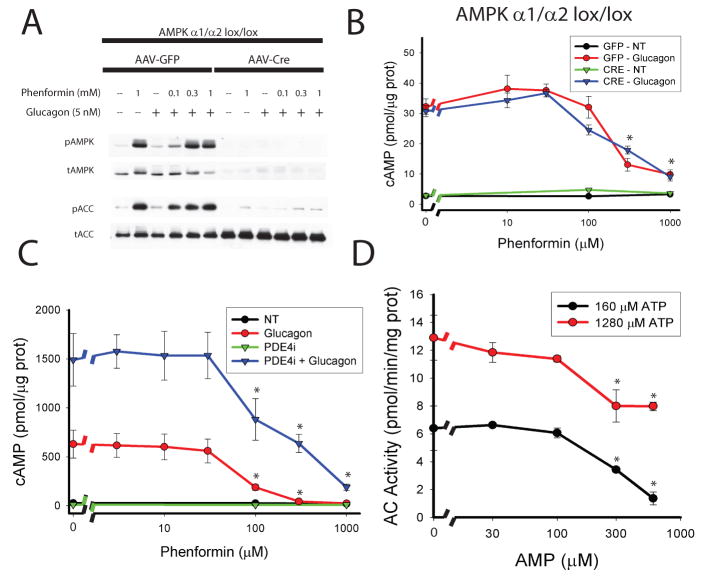
Figure 3. Mechanism of biguanide effect on cAMP production.
A. AMPK α1lox/lox/α2lox/lox mice were infected with AAV-TBG-GFP or AAV-TBG-Cre virus and 14 days later primary hepatocytes were isolated. Cells were treated with the indicated concentrations of phenformin for 2 hours followed by 5 nM glucagon for 15 minutes. A. Total cellular protein was analyzed by western blot for total and phosphorylated T172 AMPK and total and phospho-S79 ACC. B. Hepatocytes were lysed and total cellular cAMP levels were quantified by ELISA. N=4 for all points. C. Primary hepatocytes were incubated with the indicated concentrations of phenformin for 2 hours and 50 μM RO-20-1724 (PDE4i) for the final 30 minutes. Cells were then treated with 5 nM glucagon for 15 minutes, lysed, and total cellular cAMP was assayed. N=4 for all points. D. The membrane fraction of primary hepatocytes was isolated by differential centrifugation and used in assays for Adenylyl Cyclase activity in the presence of the indicated AMP and ATP concentrations, 100 nM glucagon, and 100 μM GTP. N=6 for all points. Error bars represent standard error.

