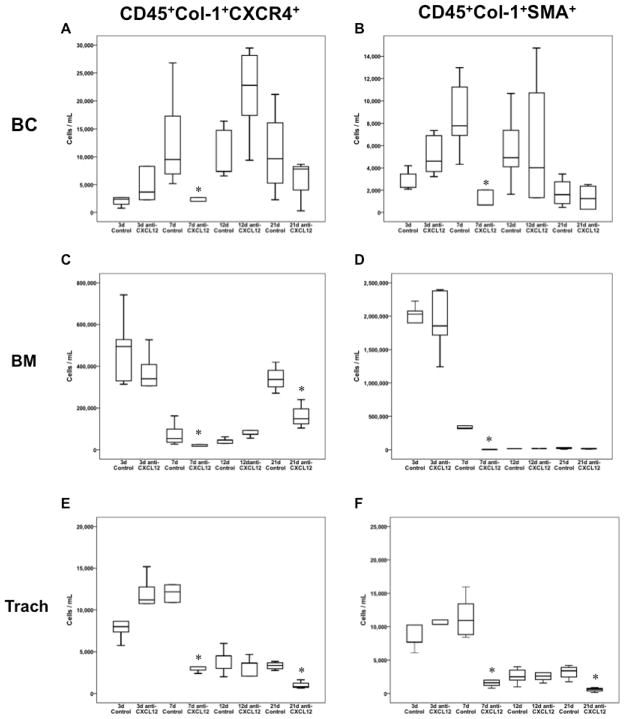
Figure 1.
Box and whisker plots depicting total fibrocyte populations in both anti-CXCL12 F(ab′)2 treated and control goat IgG F(ab′)2 treated animals following heterotopic transplant of allograft tracheas. Box and whiskers represent 25–75th and 10–90th percentiles, respectively; transverse lines represent the median. Each box and whisker plot at a given time point represents five animals, Panels A, C, and E represent undifferentiated, CD45+Col1+CXCR4+ fibrocyte populations over time in buffy coat (BC), bone marrow(BM), and tracheal allograft isolations (Trach), respectively. Panels B, D, and F represent differentiated, CD45+Col1+SMA+ fibrocyte populations in buffy coat, bone marrow, and trachea allograft isolations, respectively. *p<0.05 as determined by Mann-Whitney U test.

