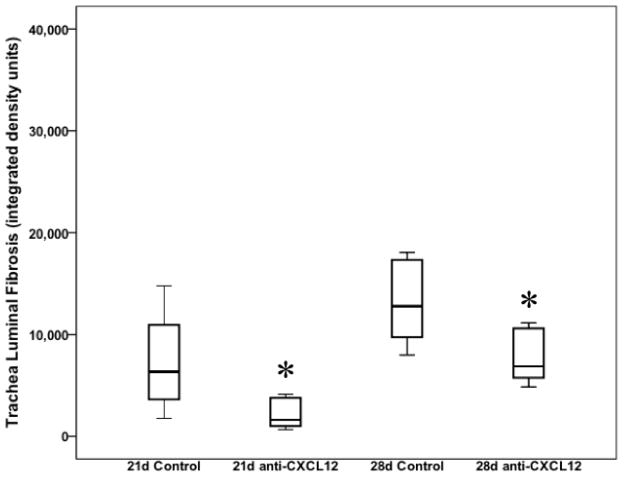
Figure 4.
Box and whisker plots depicting percent tracheal luminal fibrosis as measured by Direct Red 80 collagen stain at 21 and 28 days post transplantation. Box and whiskers represent 25–75th and 10–90th percentiles, respectively; transverse lines represent the median. *p<0.05 as determined by Mann-Whitney U test.

