Fig. 1.
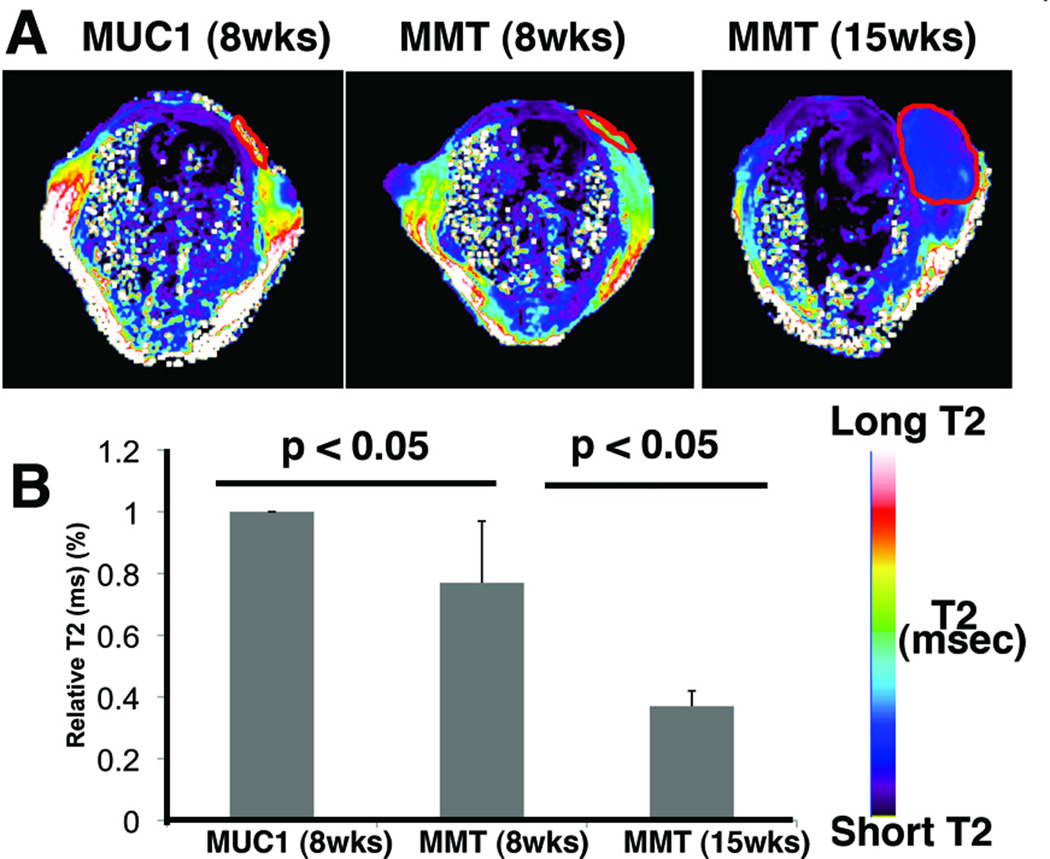
Magnetic resonance imaging of MN-EPPT accumulation in the mammary fat pads of transgenic MMT or MUC1 control mice. A. MRI. Representative color-coded T2 maps of mice (MUC1 and MMT) injected i.v. with MN-EPPT (10 mg/kg iron). There was a progressive loss of signal intensity (T2 shortening) between non-cancer (MUC1), premalignancy (8-wk MMT) and malignancy (15-wk MMT) in the mammary fat pads (outlined). B. Quantitative analysis of the T2 relaxation times, revealing that these differences are significant (p<0.05).

