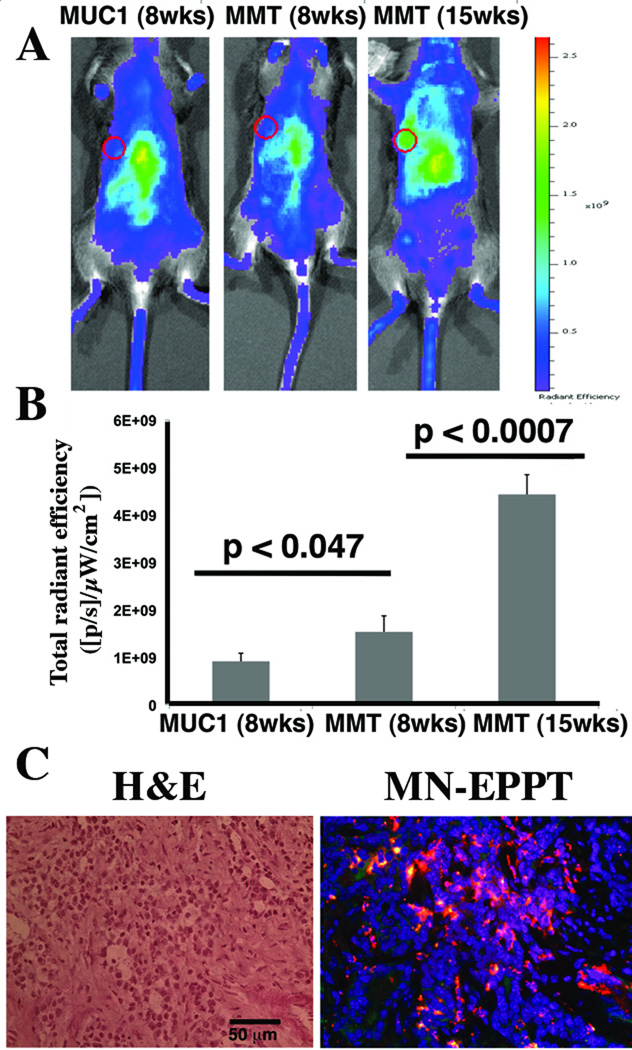
Fig. 2.
NIRF optical imaging of MN-EPPT accumulation in the mammary fat pads of transgenic MMT or MUC1 control mice. A. Representative color-coded fluorescent images of mice (MUC1 and MMT) injected i.v. with MN-EPPT. Individual fat pads are outlined. However, transformation occurs across multiple fat pads in a single animal. There was a progressive increase in signal intensity between non-cancer (MUC1), premalignancy (8-wk MMT) and malignancy (15-wk MMT). B. Quantitative analysis of radiant efficiency, revealing that these differences are significant (p<0.05). C. Fluorescence microscopy of MN-EPPT accumulation in tumor tissue, following intravenous injection of the probe (15-wk shown). Images represent an overlay of green (FITC on EPPT), red (Cy5.5 on MN), and blue (DAPI, nuclei). Bar = 50µm.

