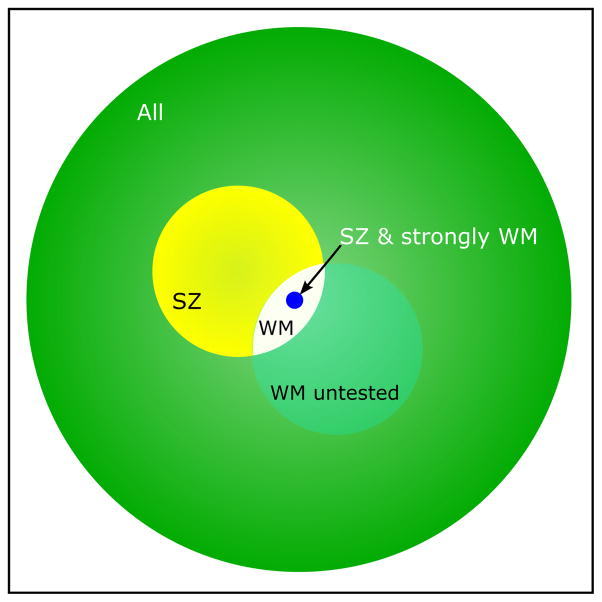
Figure 2. Schematic representation of the SNPs involved in different phenotypes.
The large green circle represents all 117,924 SNPs included after quality control and removing SNPs in LD. The yellow circle represents the 14,751 SNPs having the largest effect on schizophrenia in the target sample. The small white area stands for the subset of these SNPs (n=2,020) that do also explain variance in white matter volume. There could be more SNPs influencing white matter volume (represented by the translucent white circle), but these were not investigated. The small blue circle represents the 186 SNPs who are likely to contribute most to both schizophrenia and white matter volume. The size of the circles represents the number of SNPs in that group.

