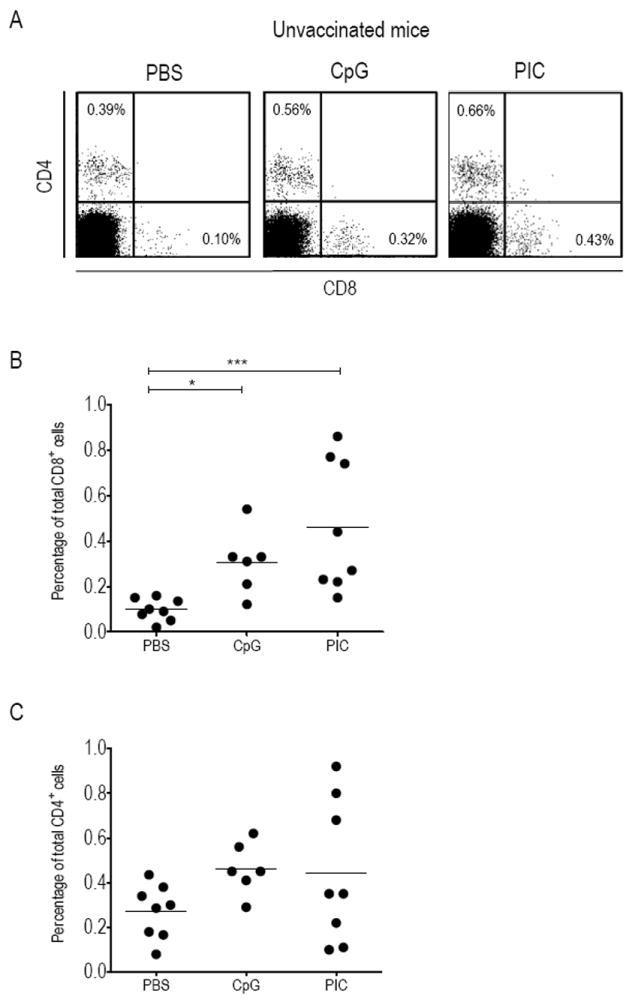
Figure 1. Increase of total CD8 or CD4 T-cells in CV upon ivag CpG or PIC.

Groups of C57BL/6 mice were ivag instilled with PBS, CpG or PIC and three days later cells recovered from single or pools of 2 CV were stained with CD8-APC antibodies and CD4-FITC antibodies and analyzed by flow cytometry. A representative result for each group of mice is shown in (A). Percentage of total CD8 T-cells (B) and total CD4 T-cells (C) within the recovered CV cells are shown for each ivag treatment. The horizontal bars represent the mean percentages. Significant differences are indicated by * for p < 0.05 and *** for p < 0.001.
