
Figure 3.
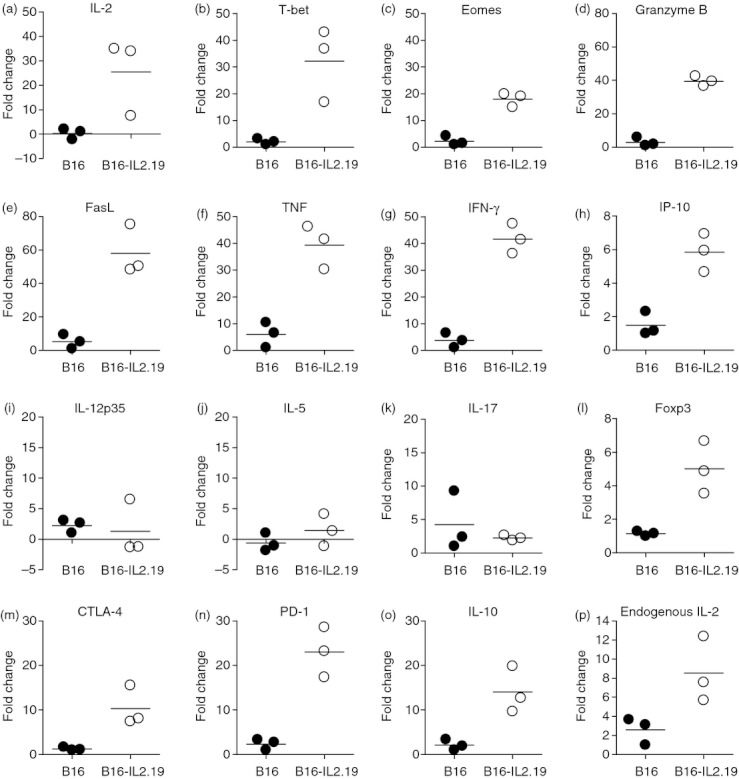
Effects of local expression of interleukin‐2 (IL‐2) on the tumour microenvironment examined by real‐time PCR. Quantitative real‐time PCR was performed for the indicated targets as described in the Materials and methods section on tumours described in Fig. 1. Data are expressed as fold increases relative to the mRNA levels in one selected sample within the B16 tumour group. This sample was used for all the fold induction calculations allowing the range of values for the parental B16 as well as the B16/IL‐2.19 to be seen. Closed circles indicate B16 tumour homogenates, open circles represent B16/IL‐2.19 tumour homogenates. Bars indicate the average of three tumours.