
Figure 1. Clearance assay validation – response of renal clearance and cardiovascular flow to gentamicin at 100 hpf.
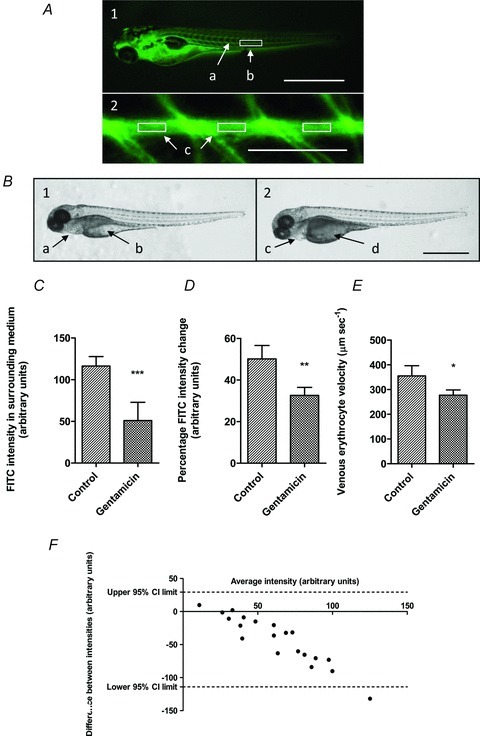
A, larvae injected (100 hpf) with 2 nl 5% FITC-inulin. 1, FITC-inulin visible throughout vascular network 30–60 s post-injection (scale bar 1 mm); a, FITC intensity visible within caudal artery; b, marked area posterior of cloaca shows area used between somites 16 and 18 for FITC intensity analysis. 2, FITC intensity over caudal artery; c, intensity measured mid-artery distant from vessel edges between intersegmental vessels in three separate regions (scale bar 500 μm). B, larvae injected with 2 nl (5 mg ml−1) gentamicin (vehicle in controls) at 76 hpf; gross phenotypes (100 hpf) in all larvae (scale bar 1 mm). 1, control; normal pericardial (a) and yolk sacs (b). 2, gentamicin; oedema of pericardial sacs (c) and darkened and distended yolk sacs (d). C–F, further 2 nl injection of 5% FITC-inulin at 100 hpf. C, mean (n= 10) intensity of FITC-inulin excreted into surrounding medium over 4 h significantly reduced (***P= 0.0004) by gentamicin (116.3 arbitrary intensity units) versus controls (51.0). D, mean (n= 10) percentage FITC-inulin intensity decrease from caudal artery over 4 h, significantly decreased (**P= 0.0019) by 17.5% 24 h post-gentamicin injection. E, mean (n= 20) posterior cardinal vein erythrocyte velocity significantly reduced (*P= 0.0118) from 354.7 to 277.0 μm s−1 by gentamicin. F, Bland–Altman analysis shows good agreement between FITC intensity change in the caudal artery and surrounding medium.