
Figure 2. Response of renal clearance and cardiovascular flow to salinity and sodium challenge at 100 hpf.
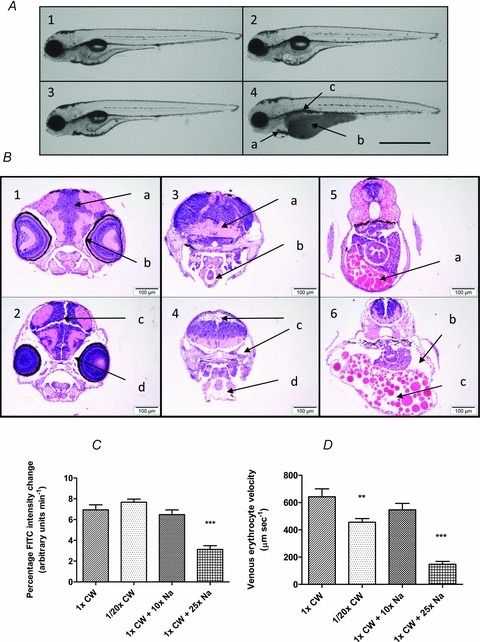
Larvae maintained in CW from one cell stage to 24 hpf prior to transfer to 1/20th CW, CW + 10× Na+, CW + 25× Na+, or maintained in CW. A, gross phenotypes in all larvae (100 hpf); 1, CW; 2, 1/20th CW; 3, CW + 10× Na+; 4, CW + 25× Na+. For these pericardial oedema (a), darkened and distended yolk sacs (b), and uninflated swim bladders (c) were observed (scale bar 1 mm). B, transverse sections (n= 9): 1, control: normal neural tissue (a) and periocular space (9/9) (b). 2, CW + 25× Na+: neural fissures (6/9) (c) and periocular oedema (9/9) (d). 3, control: normal intracranial space (a) and pericardial sac (b). 4, CW + 25× Na+: intracranial oedema (2/9) (c) and pericardial oedema (9/9) (d). 5, control: normal coelomic cavity and yolk (a). 6, CW + 25× Na+: intracoelomic oedema (b), disarray of yolk globules with increased intercellular spacing (6/9) (c) (scale bars 100 μm). C, mean (n= 20) percentage FITC clearance in the caudal artery; only significantly reduced renal clearance versus controls in larvae maintained in CW + 25× Na+ (***P < 0.05). D, mean (n= 9) venous velocity; only significantly reduced by 1/20th CW (**P < 0.05), 455 μm s−1, and CW + 25× Na+ (***P < 0.05), 116.3 μm s−1, compared to controls.