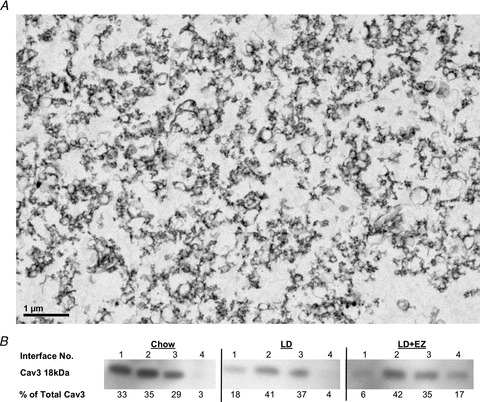
Figure 4. Electron micrograph and Caveolin-3 (Cav3) distribution of isolated sarcolemmae from upper small intestinal smooth muscle cells of male C57L mice.

A, an electron photomicrograph (original magnification, ×2000) of the plasma membranes, as multiple vesicular structures, isolated by sucrose density gradient centrifugation from the small intestinal smooth muscle cells of mice. B, the relative distributions of sarcolemmal-specific Cav3 protein at the sucrose interfaces (numbered consecutively) of three representative samples: (1) 0.25 m (∼8%)–20%, (2) 20–30%, (3) 30–35% and (4) 35–40% sucrose. The per cent total Cav3 at each interface, calculated using optical density and normalized to total protein content, gives the highest yield of Cav3 at the 20–30% sucrose interface. These samples from chow-, LD- and LD + EZ-fed mice, with per cent Cav3 totals of 35%, 41% and 42%, respectively, were assayed for cholesterol and phospholipids.
