
Figure 4. Fetal pressor and vasopressor responses to phenylephrine.
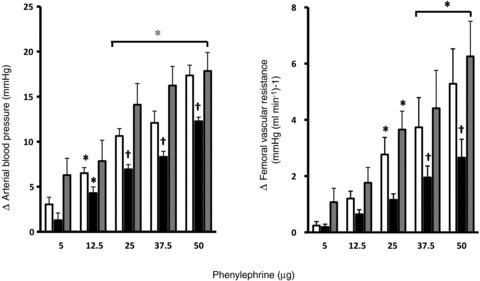
Values represent the mean ± SEM for the change from baseline in fetal arterial blood pressure and in femoral vascular resistance in response to increasing doses of phenylephrine (5, 12.5, 25, 37.5 and 50 μg) during maternal vehicle (open bars), maternal allopurinol (black bars) and maternal allopurinol with the fetal NO clamp (grey bars). Significant differences (P < 0.05) are: *vs. basal, †vs. control (two-way RM ANOVA with post hoc Newman–Keuls test).