
Figure 1. Representative recordings of inhibitory junction potentials induced by 3 protocols of EFS.
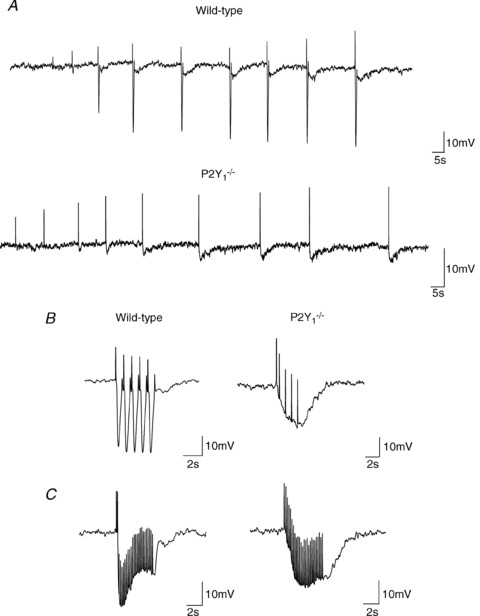
A, protocol 1: single pulses at increasing voltage of EFS (8, 12, 16, 20, 24, 28, 32, 36 and 40 V) in WT (top) and P2Y1−/− mice (bottom). B, protocol 2: train stimuli of 5 s duration and 1 Hz (5 pulses) and C, protocol 3: train stimuli of 5 s duration and 5 Hz (25 pulses). B and C, WT (left) and P2Y1−/− mice (right). (Note that positive deflections correspond to stimulus artefacts elicited at each frequency.)