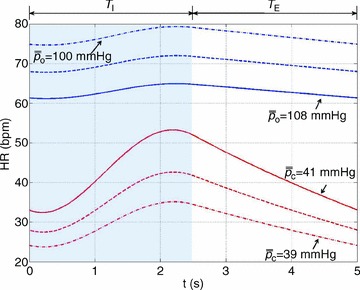
Figure 4. Stronger RSA as a result of increased average arterial partial pressure of CO2.

The optimal heart rate (HR) was calculated for Model 1a (top three curves) and Model 1b (bottom three curves) with VT= 0.5 l. In Model 1b, the averaged arterial partial pressure of CO2 was constrained to three values: 39 mmHg (dashed–dotted line), 40 mmHg (dashed line), 41 mmHg (continuous line). In Model 1a, the averaged arterial partial pressure of O2 was constrained to: 100 mmHg (dashed–dotted line), 104 mmHg (dashed line), 108 mmHg (continuous line). TI and TE are the inspiration and expiration periods, respectively. The shaded area shows the inspiration period.
