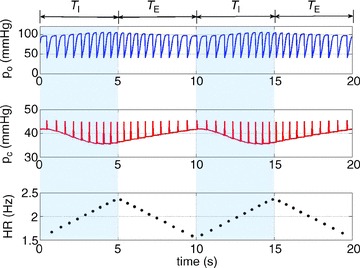
Figure 9. Mimicking pulsatile blood flow (discrete heart rate).

The arterial partial pressure of CO2 (pc, middle panel) and the arterial partial pressure of O2 (po, top panel) are initialized for every heart beat. The heart rate shown here is taken at the minimum of the continuous curve in Fig. 10 with Δ= 0.84 Hz, mean HR = 1.9605 Hz. TI and TE are the inspiration and expiration periods, respectively. The shaded areas show the inspiration period.
