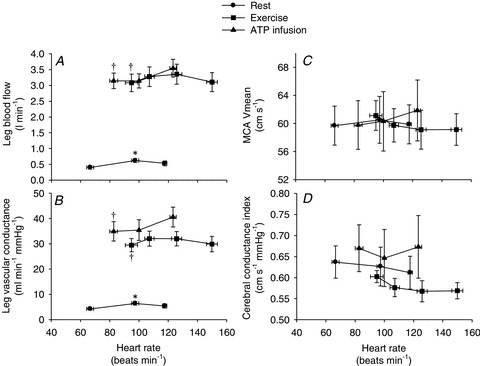
Figure 4. Leg blood flow (A), leg vascular conductance (B), middle cerebral artery Vmean (C) and brain vascular conductance index (D) as a function of heart rate.

Data are means ± SEM. *Significantly different from baseline within the same trial (P < 0.05). †Significantly different from resting conditions (A: P < 0.05; B: P < 0.001).
