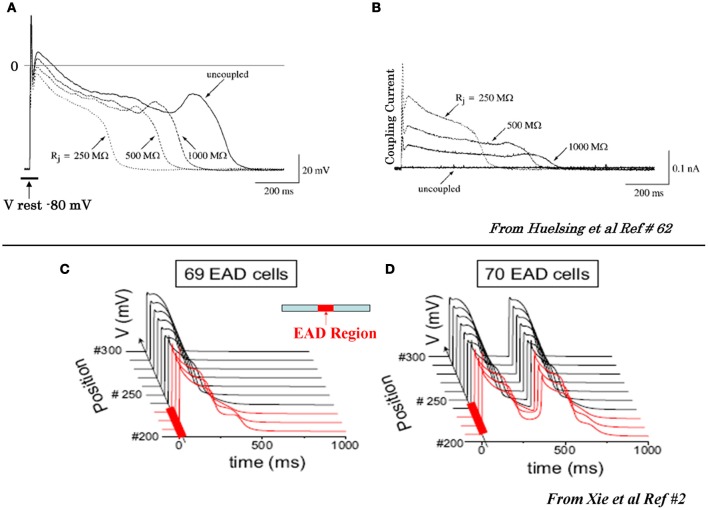
Figure 2.
Suppression of EAD by coupling to a cell with no EAD (A) and (B) and initiation of propagating EADs in 1D cable with a critical number of cell synchronously firing EADS (C) and (D). (A) In the uncoupled state (solid traces) the EAD is apparent, however, as the coupling resistance between the EAD cell and the non-EAD cell with a resting potential of −80 mV is progressively reduced the amplitude of the EAD decreases and eventually it is suppressed at coupling resistances >500 MW. (B) Intercellular current flow during coupling of the two cells with decreasing resistances (dashed traces) shown in panel (A). The solid trace shows zero current flow between the two cells in the uncoupled state (from Huelsing et al., 2000). Panels (C) and (D) show AP traces along a 1D cable, with the red traces indicating the EAD-susceptible cells in the central region (middle diagram), and the normal non-susceptible cells in black. The EAD failed to propagate with 69 susceptible cells in the central region (C), but propagated successfully with 70 susceptible cells (D) (from Xie et al., 2010).

