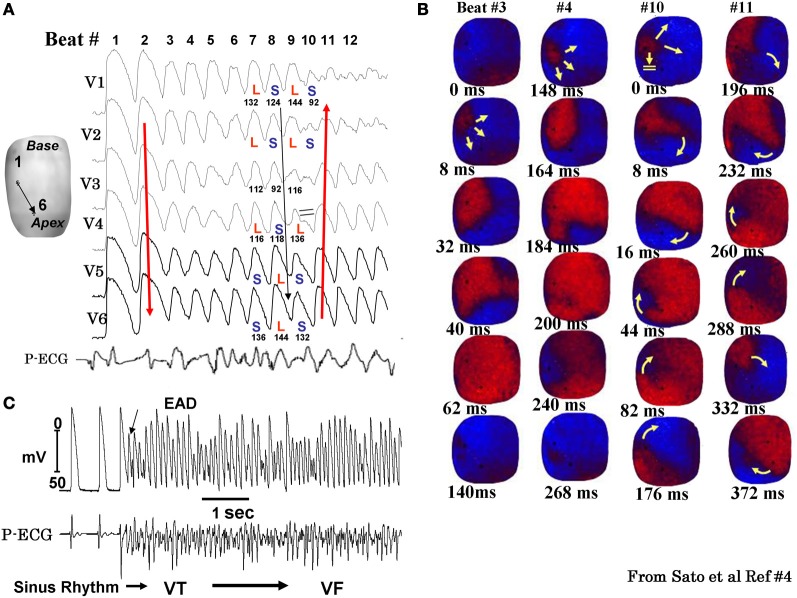
Figure 4.
Spontaneous initiation of EAD-mediated VF in a middle-aged rabbit exposed to 0.1 mM H2O2. Panel (A) shows 6 simultaneously epicardial optical APs (V1 to V6) recorded from the sites shown on the left silhouette of the heart. After nine EAD-mediated focal activations arising from the base of the heart (panel B) the wavefront undergoes block at mid LV anterior wall (beat #10) after the emergence of a spatially discordant APD alternans shown in panel (A) (L and S stand for short APD respectively). The wavefront however, continues to propagate lateral to the site of block in a clockwise direction causing the formation of a reentrant wave of excitation as shown in the snap shots of beat #11 in panel (B). The red color in the snap shots represents depolarization and the blue repolarization. The yellow arrows in the snap shots represent the direction of the wavefront propagation with double horizontal lines denoting the site of conduction block. The numbers under each snap shot is activation time starting with arbitrary zero ms for beast #3 and #4 and then again for beats #10 and #11. Panel (C) is a microelectrode recording of another VF episode recorded in the same heart showing spontaneous initiation of VF by a mechanism compatible with EAD-mediated TA (from Sato et al., 2009).

