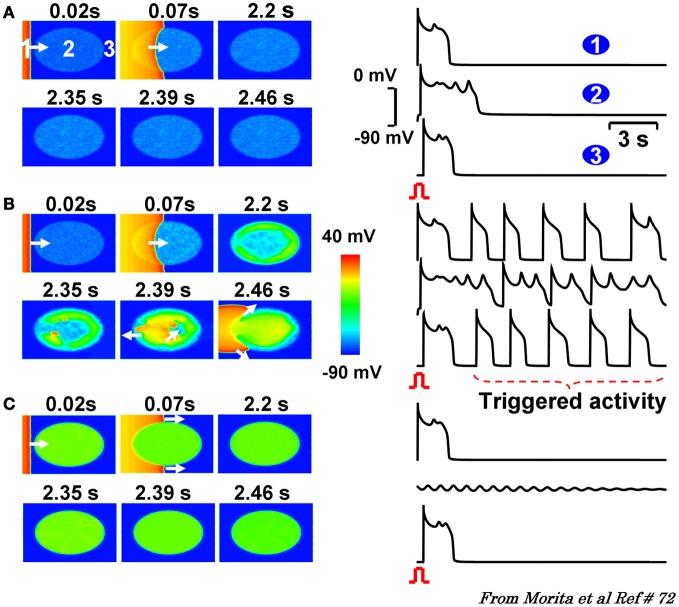
Figure 7.
2D simulations in a tissue with progressive regional increase in the number of fibroblasts to myocyte gap junction couplings. Panels (A–C) are voltage snap shots after a paced beat from the left border of the tissue (red) with central ellipse (site 2) representing the region of progressive increase in fibroblast to myocyte (F-M) coupling ratio. In panel (A) with F-M ratio of 1, promotes small amplitude non-propagating EADs. Similar dynamic scenario is also observed when the F-M ratio in the ellipse is raised to 3 as shown in panel (C). After the paced beat, EADs die out locally under these two conditions of M-F coupling. However, when the F-M ratio is in the intermediate range (1.1, panel B) the EADs and triggered beats are now of higher amplitude that propagate and excite the adjacent cardiac tissue as triggered beats. The numbers on top of each snap show denote time in seconds after the onset of paced beat from the left of the tissue. White arrows indicate the direction of wavefront propagation [From Morita et al., 2011a,b (Goldhaber, 1996)].

