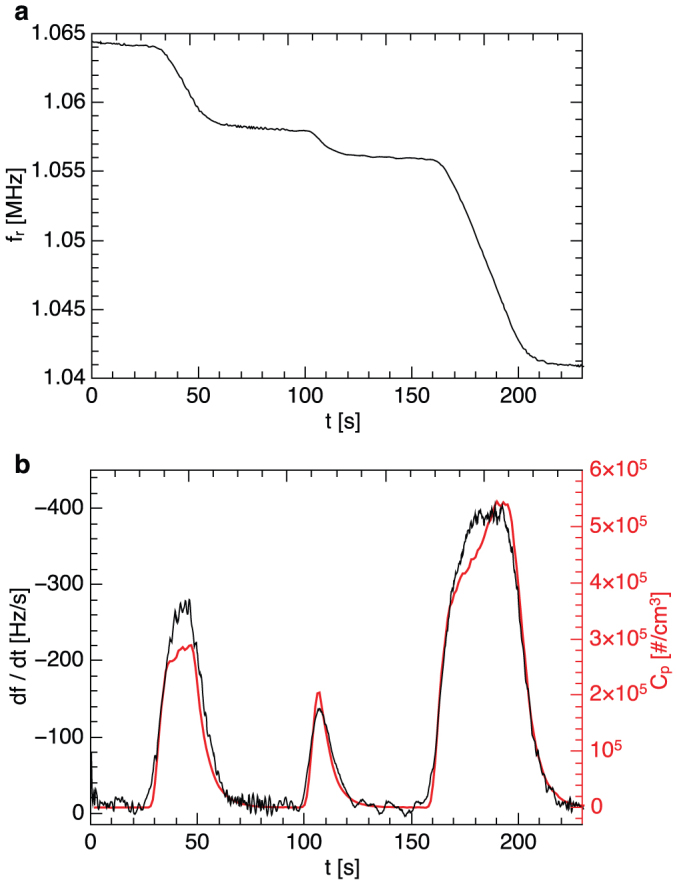
Figure 3.

(a) Frequency response of a resonant filter-fiber (w = 3 μm, h = 220 nm, L = 138 μm long silicon nitride string coated with layer of 50 nm Al) to bursts of 24.6 ± 7.4 nm sucrose nanoparticles with different concentrations.The aerosol velocity was 105 m/s. (b) Comparison of the frequency derivative to the nanoparticle concentration. The frequency derivative is a linear function of the particle concentration, as predicted by the model (2). For taking the derivative the frequency curve was smoothed with a moving window average of 50 points.
