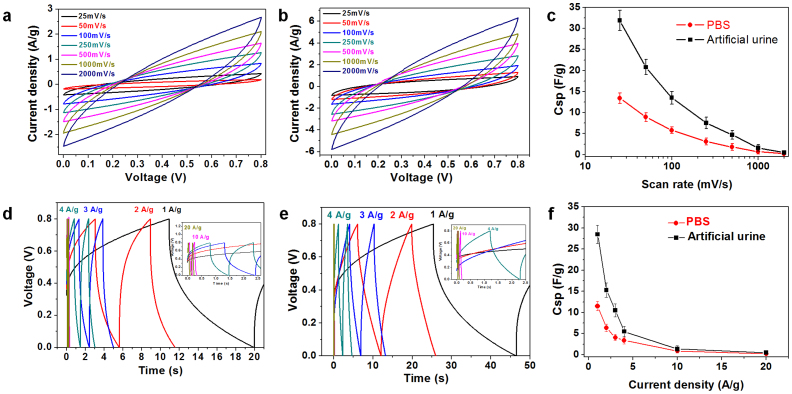
Figure 3. Electrochemical performance for PEM-Dgel in PBS and artificial urine.
(a), (b), Cyclic voltammograms of PEM-Dgel at different voltage scan rates (25 mV/s ~ 2000 mV/s) in PBS and artificial urine, respectively; (d), (e), galvanostatic charge-discharge curves of PEM-Dgel at different current densities (1 A/g ~ 20 A/g) in PBS and artificial urine, respectively; (c), (f), Specific capacitances as a function of the voltage scan rates obtained from the CV data and the current densities obtained from the charge–discharge data, respectively. The insets in d, e present magnified portions of the curves for 10 A/g and 20 A/g in each plot. Error bars represent standard deviations from three replicates.

