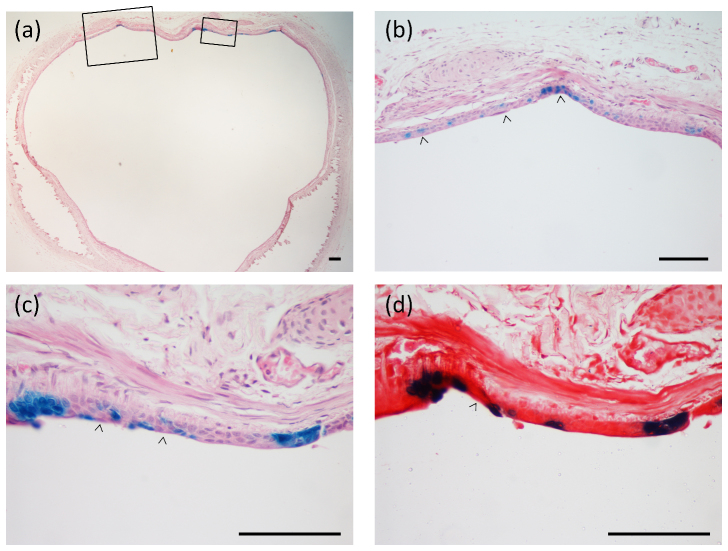
Figure 2.
(a) Cross-sections show regions of patchy LacZ gene expression along the trachea.The boxed areas in (a) are magnified in (b) and (c) to show the nature of transduction of the conducting airway epithelium. Examples of full thickness staining that includes basal cells (arrow heads), surface and individual-cell gene expression are shown. In (d) the next serial section adjacent to that shown in (c) is counterstained with Safranin-O and more clearly displays the epithelial layer staining. H&E stain in (a), (b), and (c). Scale bars 100 μm.

